
I’ve always found it remarkable that humans have a consistent body temperature. If you stray from 98.6 F by a few degrees, it’s a sign that something might be wrong and your body needs care. Our internal temperature, in other words, is a clear indicator of health.
In the world of business, B2B SaaS businesses to be specific, many hope for churn and retention benchmarks to be the same kind of indicator. Stray too far from a healthy customer retention rate and everyone knows there’s a problem.
There’s just one glaring issue with this approach: no one can agree what a good customer retention rate is for these kinds of businesses.
This is made worse by “experts” claiming they know what a good or great churn rate is and putting bad data into the universe. (I’m looking at you, Lenny.)
Polling friends at VCs, asking companies to self-report, using data from public companies, and failing to clearly define which of the dozens of churn formulas to use—as many of the worst offenders have done—gives readers the wrong idea about what good churn rates look like.
Before we go any farther, let me be clear that I don’t have the silver bullet. There’s no definitive, easy-to-understand answer for a reason. So I won’t bullshit you or oversimplify this. What I will do is walk you through why this is tough, what the data does tell us, and help you define good and great churn rates for yourself.
Why There’s No Easy Answer
Remember when I told you that there were over 40 ways to calculate churn metrics? (No? You should read that blog post.)
When someone asks me what their customer churn rate should be, my response is often a series of questions.
“Do you mean net or gross churn? And are we talking monthly churn or annual churn? Do you measure by revenue or by total number of customers?” I could go on.
First and foremost, this is difficult because it’s a complex topic. For the sake of simplicity, let’s assume for the remainder of this post that we’ll be talking about churn in terms of annual revenue, and we’ll look at both gross and net.
COVID’s Impact on Churn Metrics
Added onto this is the impact of the COVID-19 crisis on B2B SaaS businesses, which has thrown nearly every company’s KPI’s into the gutter. Some have tried to measure the impact of COVID on things like churn and retention rates. Suffice it to say, it’s too soon to tell what the long-term impact will be. The current data conflicts and doesn’t paint a clear picture, so we’ll be focusing on pre-pandemic data as we dig in.
Companies Vary…A Lot
The most important reason that churn is hard to standardize is that no two companies are exactly the same. Companies, and their target churn metrics, can vary based on:
- Industry
- Target customer type
- Platform type
- ARPU/ACV
- Company size
- Company age
- Growth rate
We’re going to break down churn benchmarks by these criteria below. But the takeaway here is that, if you run a small startup that just hit $1M in annual revenue, it does little good to compare yourself to a publicly-traded company with thousands of employees and billions in revenue (who, by the way, don’t disclose churn metrics in any GAAP-standardized way — I’m looking at you Fastly). It’s apples and oranges. Try to find data from companies that mirror yours in size, industry, and growth. This may require reading some footnotes in the future.
Why We Want Easy Answers
Churn and retention rates are incredibly valuable metrics to track on a regular basis.
In addition to being strong indicators of product-market fit and customer satisfaction, churn rates and customer retention metrics play a key role in company valuation, which is one of the primary reasons founders, CEOs, and leadership teams like to pay special attention to it. If we compare two companies that are growing at the exact same rate (meaning year-over-year revenue growth is equal) but one company has a higher net revenue retention, it’s a safe bet that this company will be valued at a significantly higher amount. Sometimes multiples higher.
Investors view net revenue retention as a proxy for customer satisfaction, and they place a high value on long-term customer relationships. After all, retained customers are the key to long-term, continued growth. So it makes sense that the higher the net revenue retention, the better the long-term outlook is for a company.
How to Know What Your Churn Rates Should Be
Before you start playing the comparison game, however, do yourself a favor — do some math based on your own company. It’s possible to determine what your churn rate and customer retention rate goals should be without leaning too heavily on benchmarks.
Remember that churn is like a leaky bucket. In order to hit your growth goals, you need to also make up for the number of customers you lost in a given period. The more you grow your new customer base, the more existing customers you’ll inevitably lose. When this happens, you can try to plug some of those holes by improving your average customer retention rate, or you can rely on sales to make up for your existing churn rate.
Start by clearly stating your goals for growth. How much do you hope to grow next quarter? Next year? Will your current churn rate make it harder to hit those goals? Or do you expect you’ll be able to outpace them, even after losing some customers?
It’s extremely helpful to quantify the number of new customers you really need in order to hit your growth goals. If it feels overwhelming, it’s a safe bet you don’t have a good churn rate and your customer retention strategy could use some attention.
A Closer Look at the Existing Data
While I’ve been a little hard on the data out there, it can be helpful—particularly when it’s reviewed in proper context. In this section, we’ll start to look at median churn rates by industry, size, revenue, etc. For the sake of simplicity, let’s say that if you’re in the upper quartile of any group, you’re doing great. And if you’re above the median, you’re doing good.
I’ve pulled together data from the following sources, which I trust. These sources are particularly helpful because they focus on privately-held B2B SaaS companies, while many others pull in data from other, less comparable industries like media and entertainment or direct-to-consumer.
- KBCM Survey
- SaaS Capital
- OpenView Partners
Overall Median Benchmarks
If we look at the sources mentioned above, the data tells a similar story around retention benchmarks. So I won’t bury the lede before we start to dig into more detailed data.
Across the sources I trust, the median retention rates tend to hover around the following:
- Median Net Retention: 100%
- Median Gross Retention: 90%
The benefit of looking at other data, of course, is that it allows you to benchmark against other key factors, like company size, industry, and customer base.
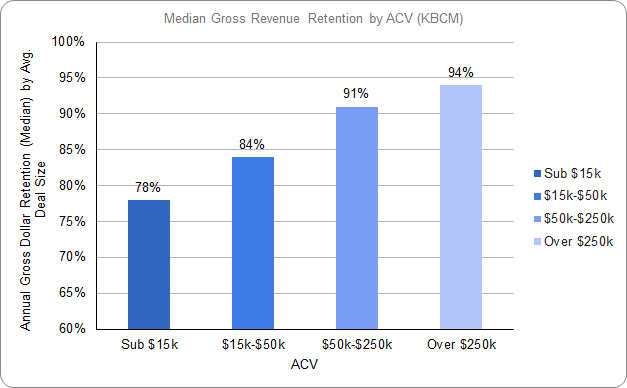
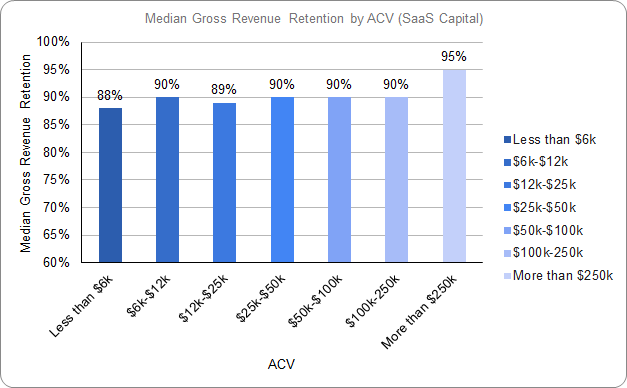
Gross Retention Benchmarks by ACV
Data Used: Looking at gross retention benchmarks by Annual Contract Value (ACV), I used data from KBCM and SaaS Capital. KBCM uses a much smaller sample of companies (about 240 vs. SaaS Capital’s nearly 1,400), which I believe leads to greater variation in their data.
Key Definitions: Gross retention does not take expansion revenue into account. So if you lost some customers but upsold others, those upsold customers aren’t reflected here.
Long Story Short: Both sources agree that the median gross retention for companies with ACVs in the $250k+ range is about 95%. Folks in that ACV range should consider 95% gross retention a good benchmark, while those below that range should benchmark to the overall median, around 90%.
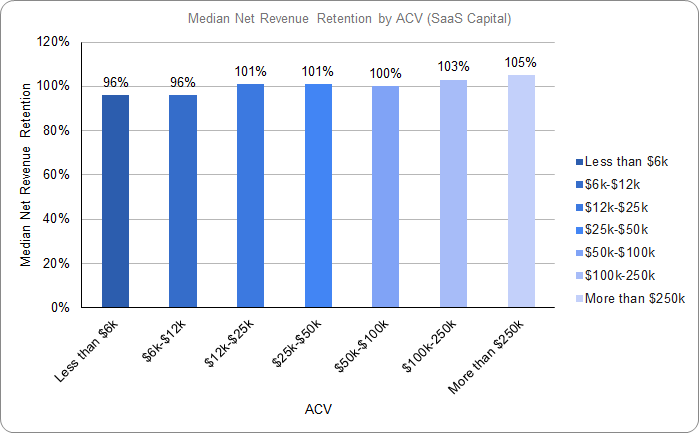
Net Retention Benchmarks by ACV
Data Used: SaaS Capital is the best available data for looking at net revenue retention by ACV, given their large sample size.
Key Definitions: Net retention does take customer expansion into account, which is why it’s common to see retention rates above 100%.
Long Story Short: Looking at the data, there’s a noticeable correlation between ACV and net revenue retention rates. It’s fair to say that if you have an ACV above $12,000, a good net retention would be greater than 100%.
According to SaaS Capital:
Net retention is more influenced by organizational structure, compensation incentives, product pricing and tiering, and product function. From those anecdotes, we have seen gross retention more predictably correlate with ACV and net retention be more variable company-to-company.
So, take this median data with a grain of salt, in other words.
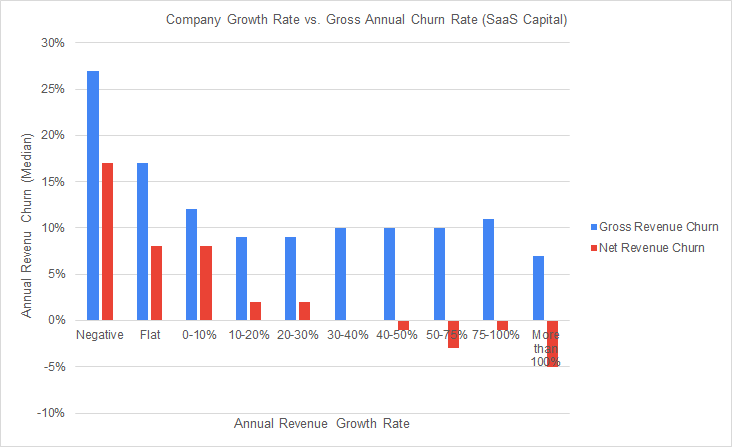
Gross & Net Churn vs. Growth Rate
Data Used: SaaS Capital compared median net and gross churn rates by average growth rate. They were the only data source that compared these metrics in this way.
Key Definitions: Remember, churn and retention are simply inverses of one another. So while retention rates hover around 90-110%, churn rates are usually between (-)10-10%, as shown here.
Long Story Short: While failing companies do lose a lot more customers than growing ones, gross churn actually does not vary that much across companies.
Net churn is clearly different between high growth and low growth companies, however. This is one of the few areas of clear differentiation in the data, so it’s worth comparing your net revenue churn to those in a similar growth-rate range. That said, the net retention number varies about 13% in the same range that shows overall growth changes of greater than 100%. There’s a correlation, but high-growth companies are making it happen through a lot more than just strong net retention numbers.
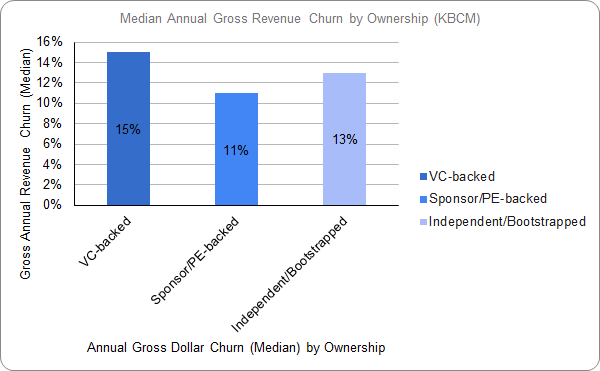
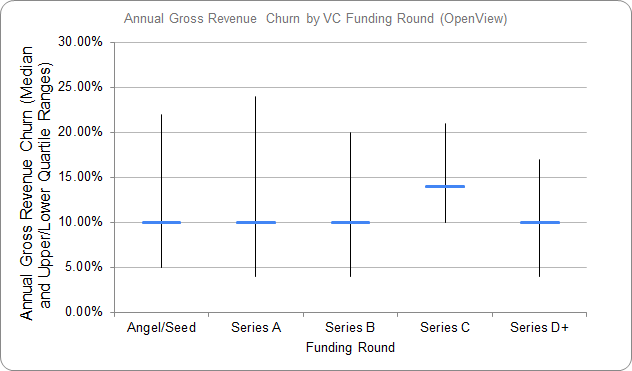
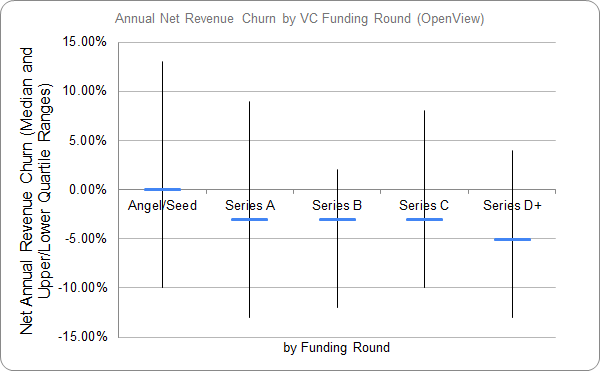
Churn by Ownership Type & Funding Round
Data Used: KBCM provides the only data on churn rates by ownership type, while OpenView is the primary data provider for the charts showing revenue by funding round.
Key Definitions: VC-backed companies typically invest in younger companies, while PE firms invest in more mature companies that are usually profitable when sold. Bootstrapped companies differ from both by not taking money from outside investors and instead by funding growth through profits.
Long Story Short: There’s surprisingly little variation in churn by ownership type. In fact, the differences shown are within the range of error, so it’s worth approaching this data with skepticism.
There is a difference in gross churn by VC funding round. However, it’s difficult to really suggest a strategy here other than “don’t be a Series C company,” which is decidedly unhelpful.
The most apparent difference is in net revenue churn. As companies “grow up” through funding rounds, it seems like they get better at driving expansion revenue. This could be due to having more products to sell or growth of internal competencies, like improved organizational structure, compensation plans, product pricing, and product function. It’s also possibly related to a bit of survivor bias. In other words, there’s a trend here that might be helpful when looking for benchmarks for your own company, but there are also a lot of variables at play.
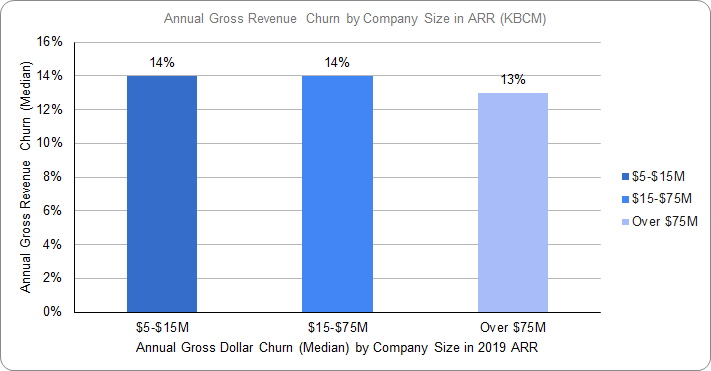
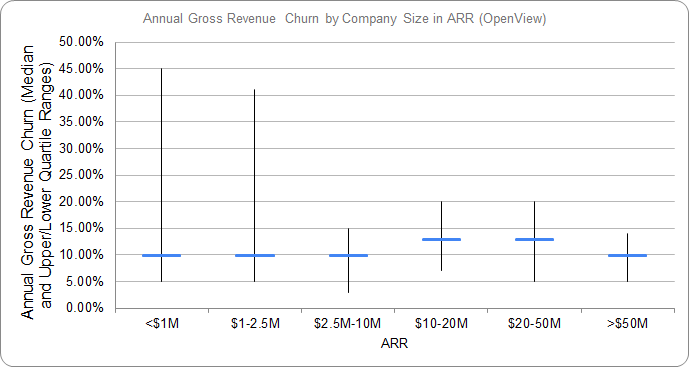
Annual Churn by Company Size
Data Used: Both KBCM and OpenView provide data on annual gross revenue churn by company size, though they batch companies by different “sizes.”
Key Definitions: ARR is defined as Annual Recurring Revenue.
Long Story Short: Median Gross Revenue Churn does not change much by company size. However, as we see with the OpenView data, it’s clear that small companies have incredibly volatile churn rates. It’s likely that these high-churn companies rarely grow into the larger ARR cohorts, remaining small or eventually closing their doors.
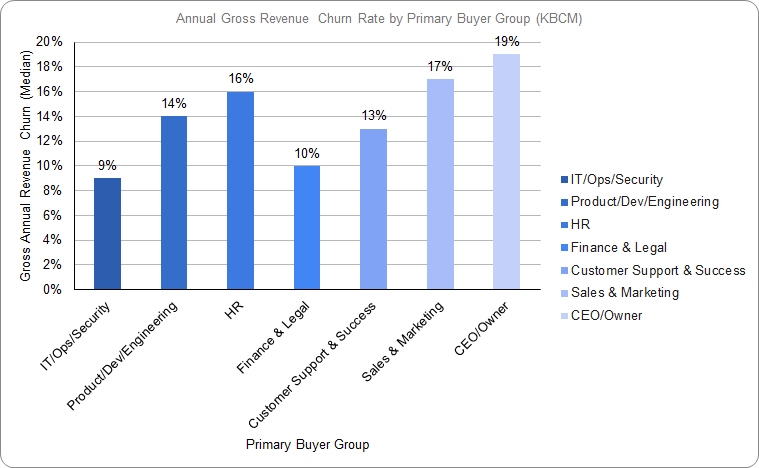
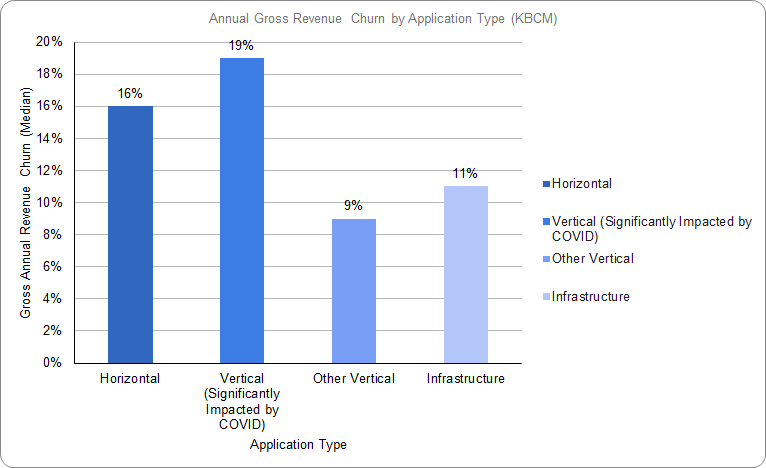
Churn by Target Customer Type
Data Used: In this section, we rely on data from KBCM to examine churn by the target buyer and application type. We also turn to data from OpenView to compare churn by target customer size. The KBCM data is gross revenue data, while OpenView shows net revenue data.
Key Definitions: Very Small Businesses (VSB) are defined as having less than 20 employees. Small to Mid-Size Businesses (SMB) have fewer than 500 employees. Midmarket companies have up to 2,000 employees.
Long Story Short: Across all surveys, who you serve and what you sell has a large effect on your gross and net annual churn rates. Selling to CEOs/Owners and Sales & Marketing are brutal businesses from a churn perspective. However, IT/Ops/Security and Legal & Finance folks have high customer loyalty.
If you’re debating creating a horizontal vs. vertical play, vertical is the way to go. Unless, of course, your vertical happens to get demolished in a global pandemic.
Selling to Very Small Businesses (VSBs) is tough from a net revenue retention perspective. The larger the companies you sell to, the better retention rates get, until you reach the enterprise which is where the sweet spot is. Now, this does not mean that it is necessarily a bad idea to sell to small customers. But know that if you do, your addressable market has to be large enough, and your Customer Acquisition Cost (CAC) has to be low enough to account for the much shorter customer lifetimes of this customer segment.
From this alone, the best product to get into would be selling Enterprise IT software — assuming your product can pass the high demands those buyers have to get in the door in the first place.
All that said, the variation here shows exactly why these numbers can vary so widely and is perhaps one of the most useful benchmarks at your disposal.
The Bottom Line: What’s a Good Customer Retention Rate? What’s a Great One?
As you looked across the charts above, there were a few points of definite variance. Churn benchmarks can, in fact, vary by things like customer types and growth rate. It’s worthwhile to look closely at the charts above and compare your business to those in similar cohorts.
With that in mind, let’s dig in a little farther and start to define good and great retention rates. Again, for the sake of simplicity, we’ll assume anything above the median is good and anything in the top quartile is great.
- Good Gross Retention: 90%+
- Great Gross Retention: 95%+
- Good Net Retention: 100%
- Great Net Retention: 110%+
I hope if you’ve read this far, you know what I’ll say next. These numbers should not be taken as fixed, time-tested benchmarks. They can give you a broad sense of what similar companies report, but the most important step in this process will be defining your company’s standards for churn and customer retention and then developing customer retention strategies and loyalty programs in order to meet them. Need some help developing your own standards? Let’s talk. I obsess over this data and can guide your organization through the minefield that is retention metrics.