
Value-based Pricing (VBP) starts with the premise that the price is how buyers and sellers divide the value in a transaction. Understanding your product’s Economic Value is critical to understanding how much value is available to divide between those parties.
This article covers:
- Why Economic Value requires you to know who your competition is
- How to identify, prioritize, and quantify your customers’ value metrics
- Six battle-tested steps to establishing your product’s Economic Value
Let’s get started.
What Is Economic Value?
Before we get started, a brief recap of the Value Cascade is in order. In his seminal work, The Strategy And Tactics Of Pricing, Thomas Nagle outlined four components of the Value Cascade. I’ve already covered Use Value in-depth, but I’ve quickly summarized Use Value and introduced the next step in the Value Cascade below to start our journey.
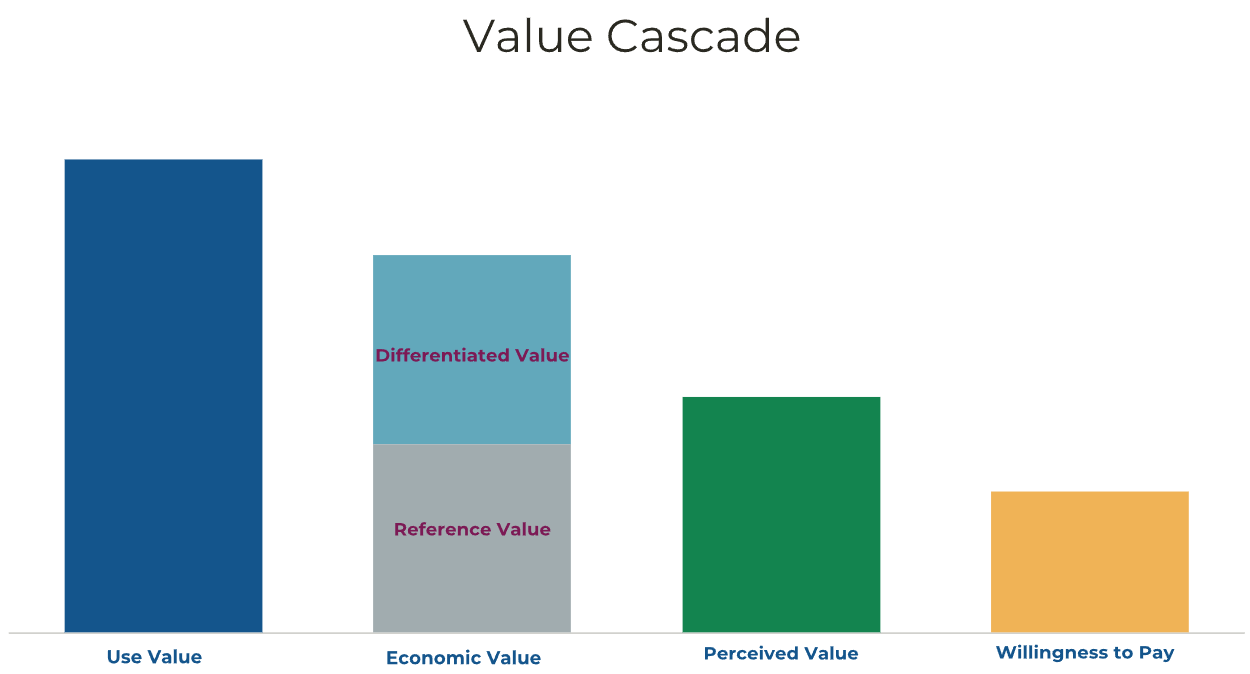
Use Value
Use Value is the sum of all the potential benefits a client could receive from your product. Think economic benefits, emotional benefits, or social benefits.
Economic Value
Economic Value, or Exchange Value, is very different from Use Value because it considers a customer’s alternatives for purchase. Or, to put it another way, competitive options compete away the ability of a firm to set prices for undifferentiated value.
Value is relative—not absolute. Economic Value captures this aspect of relative value and is composed of four components:
- Reference Value – The price of a customer’s next best competitive alternative (NBCA)
- Positive Differentiation Value – The increase in value customers receive from your SaaS product compared to the reference product’s value. Think of additional features and better performance.
- Negative Differentiation Value – The decrease in value customers receive from your SaaS product compared to the reference product’s value. Think of missing features, worse performance, or switching costs.
- Value Pool – The sum of your Positive Differentiation Value and Negative Differentiation Value. This combination illustrates the difference between your SaaS product’s total value and the reference alternative.
Forget about perceived value and willingness to pay for now—Economic Value is the primary concept we’ll explore in this post.
To calculate your Economic Value, you need to follow these six steps:
- Establish your customers’ NBCA
- Analyze the competitor and determine their prices
- Identify customer value metrics
- Prioritize the value metrics
- Quantify the value metrics
- Calculate your Value Pool and Economic Value
Let’s get to it.
Step 1) What Is Your Customers’ Next Best Competitive Alternative (NBCA)?
Your first step on the road to finding your SaaS product’s Economic Value is figuring out who exactly your competition is. Trust me—that’s a trickier question than it might appear at first glance.
If you’re looking through the Jobs-to-Be-Done (JTBD) lens, a competitive alternative for a customer’s context could be an indirect or direct competitor. Many SaaS companies focus their definition of competition too narrowly.
Of Milkshakes and Breakfast Foods
Clayton Christensen, the late HBS professor and one of the founders of JTBD, outlined this compelling example.
As part of a consulting engagement, he was trying to help McDonald’s improve sales of their milkshakes. They asked McDonald’s customers what would improve the milkshake. Should they add fruit? Should they add additional flavors to the menu? Should they increase the size? Change the thickness of the milkshakes?
Surprisingly, they learned that McDonald’s sold 50% of their shakes before 9 AM. These customers were buying milkshakes for their commute to work. It was an easy snack, filling, and gave them a pleasant distraction from the morning commute.
The milkshake wasn’t competing against soft drinks or ice cream. These customers hired milkshakes for their morning commute. McDonald’s milkshakes’ real competition was breakfast foods people could eat while driving to work. Christensen recalls some customers’ feedback:
I tried to hire donuts to do the job, but I got crumbs all over my lap. I tried to hire a banana to do the job, but have you ever tried to peel a banana while driving? And what do I do with the peel when I’m finished?
Your competition might not be who you think. You’ve got to do the research to hone in on it.
The “best” competitive alternative should be chosen in the context of your customer segmentation, as different segments will have different contexts and various competitive options.
All you have to do is answer the question, “If we didn’t exist, what would my customer use to do this job?” If that isn’t fine-grained enough, focus on what your best customers would identify as their best alternative to your product.
What if You’re the First in the Market and There’s No Competition?
You’re always competing against something, even if it is only a process. Value is always relative to something, even an existing process. Lean into the research, and remember that everything that matters is measurable.
Step 2) Establish the Competitive Reference Price
Value-based Pricing shouldn’t neglect competitive insight. It’s a requirement in VBP. The critical difference versus Competitor-based Pricing is that VBP uses competitive pricing as an input to the process, not a result.
Your SaaS product’s value is only apparent relative to the alternatives. So you need to know how much your competitors are charging.
Competitive price information may be easy to find in industries dominated by many high volume and velocity (i.e., PLG) players, as public pricing is usually available. But this information may be harder to come by in sectors dominated by more enterprise-focused companies.
If you’re trying to get this information from prospects or customers, tread carefully. You have to ask, listen and verify. Never let your salesperson get fooled by a prospect saying “Competitor X” is lower on price without asking for verification. It might not be easy, but this information can become an invaluable database for pricing decisions over time.
What if your competitors are using a wildly different pricing model?
The excellent XaaS Pricing team covered this in their article, How To Compare Companies With Different Pricing Strategies.
They explained that while some companies price by user and others by flat fee or usage, you still can and should compare them. Specifically, you want to normalize based on units or scenarios for an apples-to-apples comparison. I’ll cover this more in a future article.
Step 3) Identify Customer Value Metrics
As I’ve discussed previously, JTBD helps us think about three broad categories of Value Drivers:
- Economic/Functional Jobs
- Emotional Jobs
- Social Jobs
However, for our purposes here, we can’t stop there. We need to identify your customers’ Value Metrics. Value Metrics are the ways customers will measure the effectiveness of your product. These might include:
- Increase Revenue – Does your SaaS product help your customers’ sales or marketing team sell more?
- Decrease Risk – Does your product reduce a customer’s financial, regulatory, compliance, or security risk?
- Decrease Cost – Does your product reduce materials costs or help increase employee efficiency?
To identify value metrics, you should start with your customer’s perspective. I have found no better way to do this than in-depth customer interviews.
Listen to how customers talk about their problems, what words they use to describe the value they get from a solution, and what units they intuitively use. Note that these perspectives are likely to vary across segments.
Move from a product perspective to a customer value perspective. Move from talking about features (What do I sell?), to benefits (Why does the customer care?), and finally to value (How much is it worth?).
You’re trying to understand how your SaaS product impacts your customer’s business. There is no substitute for asking your customers questions about their business: What they do, how they create value, and how their internal processes work to create that value.
I’ve covered this in previous posts. I won’t recap too much here, but if you need a refresher, I covered this in-depth in a recent webinar.
Step 4) Prioritize the Value Metrics
What are the most critical value metrics for your customers?
You may have identified ten or more possible value metrics in the previous step. However, an Economic Value calculation based on such an unwieldy number of metrics will not serve you. Either early in determining your Economic Value or when you need to explain your rationale to customers on the front lines.
It’s best if you aim to have no more than three to five value metrics that you can deliver. Get these priorities from research with your customers or prospects in your ICP, either through qualitative or quantitative methods.
People tend to measure what’s easiest to measure, not what actually matters. But just because it’s countable on your end doesn’t necessarily mean it’s the thing you should count.
Don’t shy away from metrics that might seem unquantifiable or “too hard to measure.” Anything that matters to your customer is measurable. I recommend Douglass W. Hubbard’s book How to Measure Anything: Finding the Value of Intangibles in Business for an in-depth treatment of this topic.
Step 5) Quantifying Value Metrics
Now that you’ve identified your customers’ most critical value metrics, it’s time to quantify them. This step is tricky for many businesses that haven’t taken the time to understand the value they create for customers or the differentiation in that value versus the competition.
A savvy SaaS CEO may ask one of the first questions: “Where am I to find all this data?” Thankfully, there are several options:
- Prospects and customers
- Competitor websites
- Internal research and benchmarking
- Industry associations
- Consultants
- Research organizations
- Academic institutions
- Government sources
Your goal at this stage is to get good enough data and iterate. This process should be very familiar to you if you’re used to building your SaaS product with Agile development. You don’t need perfect data to start. Gather data, test it with your internal stakeholders and customers and refine it from there.
When quantifying your customers’ value metrics, you must keep your eyes peeled for these common mistakes:
- Are your comparisons framed correctly? – Make sure you’ve performed your quantification with a chosen customer segment. Perform due diligence on each of your segment’s NBCAs.
- Are your units in order? – Have you converted your competitors’ pricing into the correct units for an apples-to-apples comparison? Are your value metrics all calculated in the same unit? You can’t make further calculations without this.
- Avoid double-counting – You can only count a feature benefit as a cost savings or revenue increase. Doing otherwise is taking credit for the same value delivered twice.
- Don’t include any value metrics for delivering the same value as your NBCA. – The market and your prospects have already accounted for this value in the competitive alternatives reference price.
- Can you sell it? – Does the value story you’re trying to convey match the math in a straightforward, transparent way?
- Don’t assume that the Economic Value of your product is simply the percentage improvement over what your competitor offers. – Suppose your SaaS product reduces the risk of unplanned downtime by 10% over your rival’s product. It’s not simply a 10% markup on your competitor’s price for the same use case. Equating the same value is only valid when your customer can buy more of the competitor’s product to solve the same use case. This situation is rarely the case in most B2B SaaS scenarios.
Value Quantification Formulas
Next, we will look at how to create value quantification formulas. Value formulas are a way to quantify business value through arithmetic.
To build a value formula, you must deeply understand your customer’s business. What is the process by which they increase or decrease a value metric? What are the steps? Who is involved? What are the components that go into the process?
The first step of the value formula creation process consists of breaking down a customer’s process into its component parts. For my friends that have done case prep for consulting interviews, think of your MECE tree breakdown for Profit into Revenue and Costs and subsequent examinations for those variables.
Once you’ve identified the components, the next step is to build the arithmetic formula that illustrates how your product, inserted in the customer process, has a net impact on the customer’s value metric.
Let’s take a look at a possible value formula for decreasing a time metric:
- Monthly time savings in marketing campaign creation = (Time to create a new campaign) * (# of campaigns per month) * (% reduction in time for a single campaign versus NBCA)
To translate this into a cost reduction metric denominated in dollars, we’d want to add relevant variables for personnel costs per hour. This type of situation is where the art and science of value management come into play. You may have different modifiers you’d want to apply depending on if the personnel is hourly, currently running overtime to perform the task, or salaried. If they are salaried, there are potential modifiers to apply. The question then becomes the opportunity cost of that person not doing another task. Also, customers may expect that time savings due to productivity gains may not flow back to the company as the employee uses the extra time for non-business purposes.
You will repeat this process for the three to five value metrics you’ve prioritized.

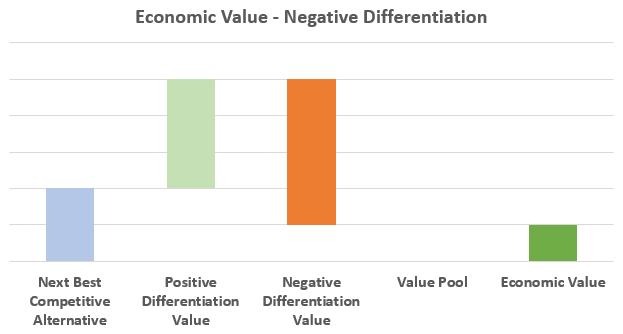
Don’t forget your negative differentiation or things your competitors do better than you. Being open and honest about your SaaS product’s drawbacks is critical to building credibility internally and externally. These items become “negative differentiation value” inputs to the Economic Value calculation.
Economic Value vs. Survey Methods
You might wonder why I recommend this process versus quantitative research methods like Van Westendorp or Conjoint. Here’s the thing—these tools are helpful in the proper context; however, most B2B SaaS companies build innovative products.
Van Westendorp and Conjoint help determine customer willingness-to-pay (WTP). But if you remember Nagle’s Value Cascade, Perceived Value comes after Economic Value and before WTP. This dependence means that Perceived Value isn’t fixed and influences WTP. You could inadvertently change respondents’ WTP responses because of how you describe the product—affecting Perceived Value.
Also, it can be challenging for research participants in a conjoint survey to appreciate or even understand the benefits of your innovation. When responding to these types of surveys, they often fail to answer as you expect.
This process can serve as a foundation for Marketing, Sales, and Customer Success to justify your price point. It’s fundamental in markets where you have a genuinely innovative product where customers may not understand your SaaS product’s value without a bit of assistance from you.
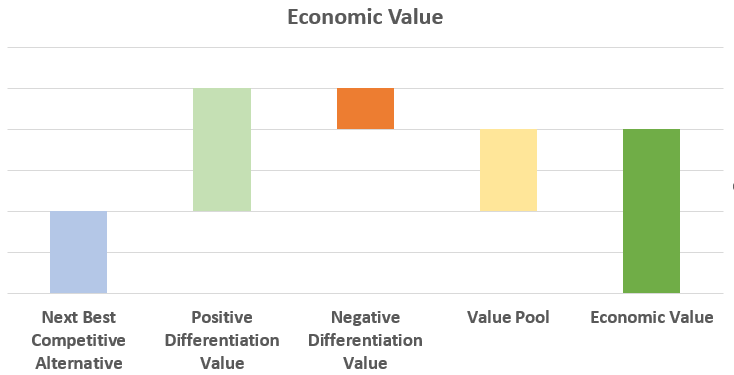
Step 6) Calculate Your Value Pool and Economic Value
Once you’ve identified and quantified the value drivers, you now have all the inputs to the Economic Value model:
- Reference Value
- Positive Differentiation Value
- Negative Differentiation Value
- Value Pool – The sum of your Positive Differentiation Value and Negative Differentiation Value. This combination illustrates the difference between your product’s total value and the NBCA.
Your next step? Take the reference price of your NBCA and add your Value Pool. This dollar value represents the Economic Value of your offering.

You may ask: What if my Value Pool is negative? In that case, your product is negatively differentiated from your competitive alternative. This insight is still helpful! This work tells you that given your value, you cannot rationally price above the reference price and should price below the reference competitor’s price.
You may also end up in a net-neutral differentiation scenario where your economic value is the same as your reference price. I’ve not shown this situation.
Remember, this is an iterative process. It’s better to be roughly right than precisely wrong. So test your value calculations with your market and internal stakeholders (like your sales team) to see if they hold water.
Rinse and repeat this process for all market segments that you are targeting. Each segment will have different importance levels for additional value drivers and specific contexts that may preclude or change the performance expected from a particular feature.
You Can’t Afford To Ignore Economic Value
Economic Value helps you frame the conversation regarding the value created for customers and gives you a baseline justification for the price you set with the market. It also indicates that your product is overpriced relative to the value you offer. If your pricing is correct, it can help steer you in other avenues, like improving value communication.
Economic Value doesn’t tell you what price to charge. It only estimates the maximum price a buyer would pay if they fully recognized the product’s value. It helps set an upper bound on your pricing. In a future post, I’ll cover the final step of the Value Cascade – Perceived Value.
Figuring all this out can be a challenge. But after reading this article, you should have all the tools you need to start managing value with confidence.